All issues
Volume 119 (2010)
- Issue 6 Pages 947-
- Issue 5 Pages 775-
- Issue 4 Pages 585-
- Issue 3 Pages 421-
- Issue 2 Pages 187-
- Issue 1 Pages 1-
Volume 119, Issue 3
Displaying 1-19 of 19 articles from this issue
- |<
- <
- 1
- >
- >|
Cover
-
2010Volume 119Issue 3 Pages Cover03_1-Cover03_2
Published: June 25, 2010
Released on J-STAGE: August 30, 2010
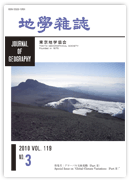
JOURNAL FREE ACCESSMt. Kilimanjaro, the highest mountain in Africa, is located in the United Republic of Tanzania (Jamhuri ya Muungano wa Tanzania), and is very popular among tourists because mountain lovers including inexperienced climbers can reach the summit. The ice cap of Kilimanjaro is often a topic of conversation because of not only its beauty but also the recent threat of its disappearance. This photograph was taken on the trekking route from Gillman's Point (5681 m) to Uhuru Peak (5895 m) on January 2, 2009 (Fig. 1). We can see the eastern end of Southern Icefields. Mt. Mawenzi (5149 m), which is about 10 km to the east, can be seen in the background. According to one view, “Kilimanjaro” means “Shining Mountain”, although the true origin of the name is unknown. Nobody may have been able to predict the disappearance of the “Shining” aspect of the Mountain.
(Yuriko NAKAO)View full abstractDownload PDF (1482K)
-
Shuji YAMAKAWA, Rikie SUZUKI2010Volume 119Issue 3 Pages Cover03_2
Published: June 25, 2010
Released on J-STAGE: August 30, 2010
JOURNAL FREE ACCESSThe photograph in Fig. 1 (taken and provided by Shun Nakano) depicts the landscape 13 years previously in January 1996 at a similar location to the cover photograph. Although the angle of the photograph in Fig. 1 is slightly different from the cover photograph, 13-year change in the shape of the ice cap can be observed.
After Thompson et al. (2009), Kilimanjaro's summit ice cover (areal extent) decreased about 1% per year from 1912 to 1953 and about 2.5% per year from 1989 to 2007. It is projected that the ice cover will almost vanish by the year 2015 (Iwata and Komori, 2010) based on past data (Thompson et al., 2002).View full abstractDownload PDF (312K)
Special Issue on “Global Climate Variations (Part III)”
-
Shuji YAMAKAWA, Rikie SUZUKI, Shigenori MARUYAMA, Jun MATSUMOTO, Junzo ...2010Volume 119Issue 3 Pages 421-426
Published: June 25, 2010
Released on J-STAGE: August 30, 2010
JOURNAL FREE ACCESSDownload PDF (420K)
Review Article
-
Masaki SATOH2010Volume 119Issue 3 Pages 427-440
Published: June 25, 2010
Released on J-STAGE: August 30, 2010
JOURNAL FREE ACCESSWe have developed a new type of atmospheric general circulation model, “global cloud-resolving model” which covers the globe with a mesh size of a few kilometers. This model enables us to directly simulate the multi-scale structure of the cloud systems of the Earth from meso-scale to planetary scale cloud disturbances. In particular, tropical cloud systems including Madden-Julian Oscillation and tropical cyclogenesis are realistically simulated by the global cloud-resolving model. It is contrasted with current atmospheric general circulation models that are used for climate projections, because they cannot simulate realistic tropical cloud disturbances in general. The global cloud-resolving model not only reproduces the geographical distribution of cloud-precipitation systems and their diurnal to intra-seasonal variabilities, but also more physically reproduces cloud properties by explicitly implementing cloud microphysical processes. It is expected that the global cloud-resolving model will play a major role in climate simulations, and that future climate projections will be more reliable than current approaches.View full abstractDownload PDF (3569K)
Short Article
-
Makoto INOUE, Shuji YAMAKAWA2010Volume 119Issue 3 Pages 441-450
Published: June 25, 2010
Released on J-STAGE: August 30, 2010
JOURNAL FREE ACCESSThe influence of stratospheric quasi-biennial oscillation (QBO) on global precipitation features was studied over a 25-year period. The years from 1980 to 2004 are classified into easterly and westerly phases of QBO. Composite analyses in Asia reveal noteworthy pluvial anomalies near the Philippines, and inactive front activity and typical drought events due to adiabatic descent over Japan during the easterly phase of QBO. Cool summers and extreme rainfall events in Japan tend to prevail in the westerly phase. In particular, ten Typhoons struck Japan in 2004 accompanied by the westerly phase of QBO.View full abstractDownload PDF (3011K)
Original Articles
-
Koji SHIMADA2010Volume 119Issue 3 Pages 451-465
Published: June 25, 2010
Released on J-STAGE: August 30, 2010
JOURNAL FREE ACCESSThe rate of recent sea ice reduction in the Arctic Ocean exceeds that of global warming. The pattern of sea ice reduction accompanies discontinuous changes. This implies that the Arctic climate system is not only influenced by global warming, but also involves significant positive feedback mechanisms that accelerate the reduction of sea ice. Changes of sea ice area in the Arctic Ocean do not show uniform reductions in both space and time. In the present study, we investigate sea ice reduction in distinct regions and time frames, taking into consideration preconditions for the occurrence of tipping points. The initiation of a positive feedback system is found in strengthening ocean and ice circulations since the late 1990s. The activation of both sea ice and ocean circulation caused ocean warming. This contributed to less formation and growth of sea ice in the Pacific Sector. Consequently, ice reduction actually occurred due to an imbalance between ice melt and formation. The sustaining of strong circulations was a precondition leading to a huge anomalous sea ice reduction in 2007 with a zonal asymmetric distribution. The resultant zonal asymmetry establishes a new atmospheric pattern (dipole pattern) associated with southerly winds in the Pacific sector of the Arctic Ocean. Now, the Arctic climate is governed by a strong coupling system linking ocean, ice, and atmosphere. Multi-disciplinary studies are now required to understand the catastrophic Arctic changes and the fate of the Arctic and global climate.View full abstractDownload PDF (3651K) -
Atsumu OHMURA2010Volume 119Issue 3 Pages 466-481
Published: June 25, 2010
Released on J-STAGE: August 30, 2010
JOURNAL FREE ACCESSGlacier mass balance and secular changes in mountain glaciers and ice caps are evaluated from the annual net balance of 161 glaciers from 17 glacierized regions of the world. Further, the annual net balance is split into winter and summer balances for 35 glaciers of 11 glacierized regions. The global means are calculated by weighting glacier and regional surface areas. The area-weighted global mean net balance for the period 1960 to 2000 is -250 mma-1w.e. (-138 km3a-1w.e.), with seasonal components of 1470 mma-1w.e. (810 km3a-1w.e.) for winter and -1725 mma-1w.e. (-950 km3a-1w.e.) for summer balances. The linear-fitted global net balance is accelerating at a rate of -11 mma-2. The main driving force behind this change is the summer balance with a rate of -12 mma-2. The decadal balance, however, shows significant fluctuations: melt reached its peak around 1945, followed by a decrease. The annual net balance, although negative for the global mean, approached equilibrium from the 1960s to 1980s. Some regions experienced a period of positive balance during this time, for example, Europe. The balance has become strongly negative since the early 1990s. These decadal changes correspond to periods of global dimming (for smaller melt) and global brightening (for larger melt). The total radiation at the surface changed as a result of an imbalance between steadily increasing greenhouse gases and fluctuating aerosol emissions.
The mass balance of the Greenland ice sheet and the surrounding smaller glaciers is negative at -74 mma-1 with an accumulation of 297 mma-1w.e. (519 km3a-1w.e.), melt ablation -169 mma-1w.e. (-296 km3a-1w.e.), calving ablation -181 mma-1w.e. (-316 km3a-1 w.e.) and the bottom melt -21 mma-1w.e. (-35 km3a-1w.e.). At present, it is difficult to detect any statistically significant trends for these components. The total mass balance of the Antarctic ice sheet is considered to be too premature to evaluate.
The estimated sea-level contributions in the 20th Century are 3.7 cm by mountain glaciers and ice caps, 3.5 cm by Greenland, 2 cm by ocean thermal expansion. The difference of 8 cm between these components and the estimated value with tide-gage networks (17 cm) must be caused by the mass balance of Antarctica and other sources that were not considered in the present work, for example, the melt of permafrost.View full abstractDownload PDF (1144K)
Tutorial
-
Tsuyoshi KAWASAKI2010Volume 119Issue 3 Pages 482-488
Published: June 25, 2010
Released on J-STAGE: August 30, 2010
JOURNAL FREE ACCESSStructure (regime) of the global environmental system composed of atmosphere, oceans and marine ecosystems has repeatedly shifted from one state to the other on an interdecadal timescale, which is called “regime shift” (RS). The RS was first discovered in 1983 with synchronous fluctuations in biomass of three distantly separated sardine populations in the Pacific, which were closely linked to the global air temperatures, and the synchronized occurrences of an alternation between the sardine and anchovy in different areas were also observed. Similar synchronized variations have been detected thereafter in a wide range of taxa and ecosystems. Since the late 1980s, the RS has been reported about the ocean climate in the North Pacific Ocean as well as in the Atlantic. Studies in these different areas have been merged, creating a new interdisciplinary study area. The concept of the RS has had an effect on the traditional management regime of marine living resources and the UN Convention on the Law of the Sea has to be re-examined. Global warming and overfishing could disrupt the normal processes of the RS.View full abstractDownload PDF (825K)
Review Article
-
Itaru KOIZUMI, Tatsuhiko SAKAMOTO2010Volume 119Issue 3 Pages 489-509
Published: June 25, 2010
Released on J-STAGE: August 30, 2010
JOURNAL FREE ACCESSAnnual sea-surface temperatures (SSTs) (°C) were derived from a regression analysis between the ratio of warm- and cold-water diatoms (Td' ratio) in 123 surface sediment samples around the Japanese Islands and measured mean annual SSTs (°C) at the core sites. The cross spectra between the atmospheric residual 14C (‰), and annual SSTs (°C) of cores DGC-6 (Japan Sea) and MD01-2421 (off Kashima), respectively, consist of five dominant periods: 6000, 2400, 1600, 950, and 700 years.
The amplitude of fluctuations of annual SSTs (°C) in the millennial time scale during the Holocene after the Younger Dryas is within 6-10°C. Periodic variations of annual SSTs (°C) can be correlated within error to abrupt climatic events reported from different paleoclimatic proxy records in many regions of the Northern Hemisphere. The cooling time of annual SSTs (°C) also corresponds to the triple events of high 14C values in the atmospheric residual 14C records, as well as the Bond events in the North Atlantic.View full abstractDownload PDF (2587K)
Original Article
-
Hiroko MIYAHARA2010Volume 119Issue 3 Pages 510-518
Published: June 25, 2010
Released on J-STAGE: August 30, 2010
JOURNAL FREE ACCESSThe relationship between solar activity and climate change in the past can be examined using proxy records. Variations of solar activity can be reconstructed based on carbon-14 in tree rings, which are produced by galactic cosmic rays modulated by the solar wind, while climate change can be reconstructed from changes of tree-ring growth rate or content of stable isotopes in ice cores from the polar region. A comparison of solar activity and climate change at the Maunder Minimum in the 17th century and the Early Medieval Maximum Period in the 9-10th century suggests that the sun plays an important role in climate change even on a decadal time scale. The characteristic variations detected in climate change suggest the mechanism of solar influence on climate involves galactic cosmic rays. Variable features of eleven-year and twenty-two year cycles of solar activity and consequent variations of cosmic rays are possible origins of complex variations of climate change on decadal to multi-decadal time scales. We summarize variations of solar activity and cosmic rays during the past 1200 years and their possible influence on climate change.View full abstractDownload PDF (1103K)
Review Articles
-
Does Cloud Amount Decrease during Forbush Decreases?Ryuho KATAOKA2010Volume 119Issue 3 Pages 519-526
Published: June 25, 2010
Released on J-STAGE: August 30, 2010
JOURNAL FREE ACCESSPossible influences of cosmic rays on terrestrial climate have been studied by many researchers since a good correlation between neutron monitor counts and global cloud amount was reported by Svensmark and Friis-Christensen in 1997. The cosmic ray-cloud relationship may be best tested during Forbush decrease events, in which cosmic rays largely decrease for several days associated with coronal mass ejections. Some cloud parameters are likely to respond to the transient decrease of cosmic rays with a typical time delay of several days, although we do not know the physics behind the cosmic-ray cloud relationship.View full abstractDownload PDF (569K) -
Takahiro AZE2010Volume 119Issue 3 Pages 527-533
Published: June 25, 2010
Released on J-STAGE: August 30, 2010
JOURNAL FREE ACCESSCosmogenic Radio Nuclides (CRNs) are produced by nuclear reactions induced by cosmic rays in the Earth's atmosphere. The production rate of CRNs varies because changes in geomagnetic field intensity and solar activity strongly influence galactic cosmic rays, especially the lower part of energy. CRNs are produced in the upper atmosphere and are deposited on ice sheets in both Greenland and Antarctica, hence, ice cores in the polar regions provide excellent records of past histories of cosmic rays because of their continuous and relatively simple depositional processes. In recent studies, high-resolution records of 10Be flux from ice cores have been reported, and these revealed the continuity of 205-year solar cycles over the last glacial period. In particular, the changes induced in the production rate of CRNs by solar modulations increased during periods of low geomagnetic field intensity, such as the Laschamp geomagnetic excursion. The results obtained in this study suggest that it may be possible to obtain a better understanding of long-term solar activity through a high-resolution 36Cl analysis of the polar ice sheet.View full abstractDownload PDF (425K) -
Junichiro KURODA, Katsuhiko SUZUKI, Naohiko OHKOUCHI2010Volume 119Issue 3 Pages 534-555
Published: June 25, 2010
Released on J-STAGE: August 30, 2010
JOURNAL FREE ACCESSAlthough causal linkages between massive volcanic events and extreme climatic events have long been discussed, no consensus has been established. Recent developments of heavy metal isotope analyses such as lead (Pb) and osmium (Os) enable us to reconstruct detailed volcanic events from marine sedimentary records. Based on these isotopic records, we have investigated temporal relationship between massive volcanic events associated with large igneous provinces (LIPs) and Cretaceous Oceanic Anoxic Events (OAEs). In this paper we overview recent work on mid-Cretaceous OAE-1a (120 Ma) and OAE-2 (94 Ma) and their linkages with Ontong Java Plateau and Caribbean/Madagascar LIPs, respectively.
Marine sediments deposited across the early Aptian OAE-1a show two prominent negative shifts of seawater osmium isotopic ratios, suggesting duplicate inputs of unradiogenic osmium from the mantle. The lead isotopic record suggests that the main part of the Ontong Java Plateau was formed by deep submarine eruptions. On the other hand, marine sediments deposited across the end-Cenomanian OAE-2 interval indicate an abrupt shift of Pb isotopic ratios, suggesting an increased supply of volcanic Pb via subaerial eruption. Our data indicate strong consistency between magmatic events and extreme climatic events for both OAE-1a and OAE-2, although the eruption processes differ. A more precise discussion of the causal mechanisms between these events will be presented in the near future.View full abstractDownload PDF (3427K)
Tutorial
-
Rikie SUZUKI2010Volume 119Issue 3 Pages 556-561
Published: June 25, 2010
Released on J-STAGE: August 30, 2010
JOURNAL FREE ACCESSIn mid-November, 2009, a breach of the server of the Climatic Research Unit (CRU) of the University of East Anglia, UK, occurred, and more than 1,000 e-mails were copied and disseminated over the Internet. CRU is one of the leading climatology institutes, and has constructed a long-term world temperature database that was referenced in the assessment report of the Intergovernmental Panel on Climate Change (IPCC) as evidence of global warming. The words “trick” and “hide the decline” in an e-mail, which mentioned the process for preparing the temperature time series, generated the allegation; those words demonstrated that scientists at CRU intended to falsify data to exaggerate warming. However, it can be regarded that the allegation was a manufactured controversy originating from irrelevant interpretations of personal e-mails at CRU. Scientists are now being requested to ensure that scientific knowledge and understanding are convincing not only to scientists but also to the general public.View full abstractDownload PDF (325K)
Short Articles
-
Toshinori SASAKI, Toshihiko SUGAI, Takashi OGAMI, Makoto YANAGIDA, Ken ...2010Volume 119Issue 3 Pages 562-567
Published: June 25, 2010
Released on J-STAGE: August 30, 2010
JOURNAL FREE ACCESSPsychometric lightness (L* value) measured by a colorimeter offers a rapid means of obtaining the organic carbon content of sediment. We measured peat and lacustrine sediments covering the past 300 ka—106 samples for L* value and 197 samples for organic carbon content. L* values are highly correlated with organic carbon contents. Therefore, L* values are a convenient alternative to measuring organic carbon contents.View full abstractDownload PDF (1478K) -
Hidetsugu YOSHIDA2010Volume 119Issue 3 Pages 568-578
Published: June 25, 2010
Released on J-STAGE: August 30, 2010
JOURNAL FREE ACCESSThe Japanese Islands are tectonically active and humid. Thus, erosion and deposition are the primary processes controlling geomorphic development. Catastrophic sector collapses at volcanoes should be considered significant in this context. This study examines the geomorphological role of volcanic sector collapses in Japan, introducing 58 cases with their respective occurrence ages and volumes (≥ 1×10⁸ m3). We find that the frequency of sector collapses becomes exponentially higher as the collapse magnitude decreases. The total volume of the dissected volcanic edifice caused by catastrophic collapses amounts to ca. 6.4 km3 (640×108 m3) during the last 500 years. This value can be translated into an annual denudation rate of 0.53 mm/y per unit area of the Quaternary volcanoes (ca. 24000 km2), which is comparable to the contemporary denudation rate of non-volcanic mountains in Japan. Therefore, although volcanic sector collapses occur intermittently, we have to consider them as sediment sources that are indispensable to an understanding of geomorphology in Japan.View full abstractDownload PDF (563K)
Book Review
-
[in Japanese]2010Volume 119Issue 3 Pages 579-581
Published: June 25, 2010
Released on J-STAGE: August 30, 2010
JOURNAL FREE ACCESSDownload PDF (268K)
Pictorials
-
Jiro KOMORI, Phuntsho TSHERING2010Volume 119Issue 3 Pages iii
Published: June 25, 2010
Released on J-STAGE: August 30, 2010
JOURNAL FREE ACCESS -
Atsumu OHMURA2010Volume 119Issue 3 Pages iv
Published: June 25, 2010
Released on J-STAGE: August 30, 2010
JOURNAL FREE ACCESS
- |<
- <
- 1
- >
- >|