
- Issue 16 Pages 2157-
- Issue 15 Pages 1805-
- Issue 14 Pages 1613-
- Issue 13 Pages S1141-
- Issue 12 Pages S1037-
- Issue 11 Pages 1443-
- Issue 10 Pages 1273-
- Issue 9 Pages 1077-
- Issue 8 Pages 917-
- Issue 7 Pages 751-
- Issue 6 Pages 585-
- Issue 5 Pages S389-
- Issue 4 Pages S1-
- Issue 3 Pages 403-
- Issue 2 Pages 233-
- Issue 1 Pages 19-
- Issue 16 Pages 2153-
- Issue 15 Pages 1977-
- Issue 14 Pages 1813-
- Issue 13 Pages S1285-
- Issue 12 Pages S1043-
- Issue 11 Pages 1667-
- Issue 10 Pages 1481-
- Issue 9 Pages 1231-
- Issue 8 Pages 891-
- Issue 7 Pages 711-
- Issue 6 Pages 538-
- Issue 5 Pages S407-
- Issue 4 Pages S1-
- Issue 3 Pages 347-
- Issue 2 Pages 173-
- Issue 1 Pages 14-
- Issue 16 Pages 1837-
- Issue 15 Pages 1711-
- Issue 14 Pages 1569-
- Issue 13 Pages S1205-
- Issue 12 Pages S1034-
- Issue 11 Pages 1423-
- Issue 10 Pages 1269-
- Issue 9 Pages 1059-
- Issue 8 Pages 925-
- Issue 7 Pages 775-
- Issue 6 Pages 627-
- Issue 5 Pages S287-
- Issue 4 Pages S1-
- Issue 3 Pages 301-
- Issue 2 Pages 147-
- Issue 1 Pages 12-
- Issue 16 Pages 2179-
- Issue 15 Pages 1795-
- Issue 14 Pages 1631-
- Issue 13 Pages S1053-
- Issue 12 Pages S1023-
- Issue 11 Pages 1501-
- Issue 10 Pages 1315-
- Issue 9 Pages 987-
- Issue 8 Pages 767-
- Issue 7 Pages 621-
- Issue 6 Pages 473-
- Issue 5 Pages S305-
- Issue 4 Pages S1-
- Issue 3 Pages 299-
- Issue 2 Pages 151-
- Issue 1 Pages 16-
- Issue 16 Pages 1945-
- Issue 15 Pages 1699-
- Issue 14 Pages 1531-
- Issue 13 Pages S1055-
- Issue 12 Pages S1013-
- Issue 11 Pages 1367-
- Issue 10 Pages 1215-
- Issue 9 Pages 1087-
- Issue 8 Pages 887-
- Issue 7 Pages 721-
- Issue 6 Pages 507-
- Issue 5 Pages S317-
- Issue 4 Pages S1-
- Issue 3 Pages 343-
- Issue 2 Pages 187-
- Issue 1 Pages 17-
- Issue 16 Pages 2405-
- Issue 15 Pages 2067-
- Issue 14 Pages 1865-
- Issue 13 Pages 1675-
- Issue 12 Pages S1055-
- Issue 11 Pages S1015-
- Issue 10 Pages 1479-
- Issue 9 Pages 1129-
- Issue 8 Pages 895-
- Issue 7 Pages 711-
- Issue 6 Pages 545-
- Issue 5 Pages S325-
- Issue 4 Pages S1-
- Issue 3 Pages 369-
- Issue 2 Pages 193-
- Issue 1 Pages 16-
- Issue 16 Pages 2573-
- Issue 15 Pages 2261-
- Issue 14 Pages 2073-
- Issue 13 Pages S1111-
- Issue 12 Pages S1001-
- Issue 11 Pages 1867-
- Issue 10 Pages 1657-
- Issue 9 Pages 1409-
- Issue 8 Pages 1043-
- Issue 7 Pages 841-
- Issue 6 Pages 649-
- Issue 5 Pages S415-
- Issue 4 Pages S1-
- Issue 3 Pages 431-
- Issue 2 Pages 225-
- Issue 1 Pages 3-
- |<
- <
- 1
- >
- >|
-
2019 Volume 105 Issue 10 Pages Cover-
Published: October 01, 2019
Released on J-STAGE: September 30, 2019
JOURNAL OPEN ACCESSDownload PDF (660K) -
2019 Volume 105 Issue 10 Pages Contents-
Published: October 01, 2019
Released on J-STAGE: September 30, 2019
JOURNAL OPEN ACCESSDownload PDF (521K) -
2019 Volume 105 Issue 10 Pages Editorial-
Published: October 01, 2019
Released on J-STAGE: September 30, 2019
JOURNAL OPEN ACCESSDownload PDF (230K)
-
Setsuo Takaki2019 Volume 105 Issue 10 Pages 941-956
Published: 2019
Released on J-STAGE: September 30, 2019
 JOURNAL OPEN ACCESS FULL-TEXT HTML
Work hardening is one of powerful strengthening methods in metals. In this paper, the work hardening behavior is reviewed on ferritic steel from the initial stage to severe deformation stage. The work hardening behavior is roughly separated to three stages: 1) Dislocation strengthening without the change of ferrite grain size (true strain < 2.66). 2) Dislocation strengthening accompanying dynamic grain refinement (true strain > 2.66). 3) Grain refinement strengthening exceeds the strength obtained by dislocation strengthening (Grain size < 0.3 μm). With decreasing grain size and increasing carbon content, the introduction of dislocations is promoted thus yield stress (or flow stress) is enhanced at an identical percentage of deformation due to the increased dislocation density. In addition, the behavior of dislocation strengthening depends on not only dislocation density but also the character of dislocations and their arrangement. When deformation strain exceeds 2.66 in true strain, dynamic grain refinement starts and the decrease of grain size affects to make the dislocation density increase. The limit of dislocation strengthening is around 1.2 GPa, therefore the mechanism of work hardening changes finally to grain refinement strengthening when the grain size has been refined below 0.3 μm through the dynamic grain refinement. As a result, it is concluded that the mechanism of work hardening is dislocation strengthening on the early stage of deformation but grain refinement strengthening on the latter stage of work hardening.
Effect of ferrite grain size d on the flow stress σt at ε=0.5. The broken line shows the yield stress obtained by Eq.23. Fullsize ImageView full abstractDownload PDF (2852K) Full view HTML
-
Ataru Uchida, Yoshiaki Yamazaki, Shohei Matsuo, Yasuhiro Saito, Yohsuk ...2019 Volume 105 Issue 10 Pages 957-964
Published: 2019
Released on J-STAGE: September 30, 2019
 JOURNAL OPEN ACCESS FULL-TEXT HTML
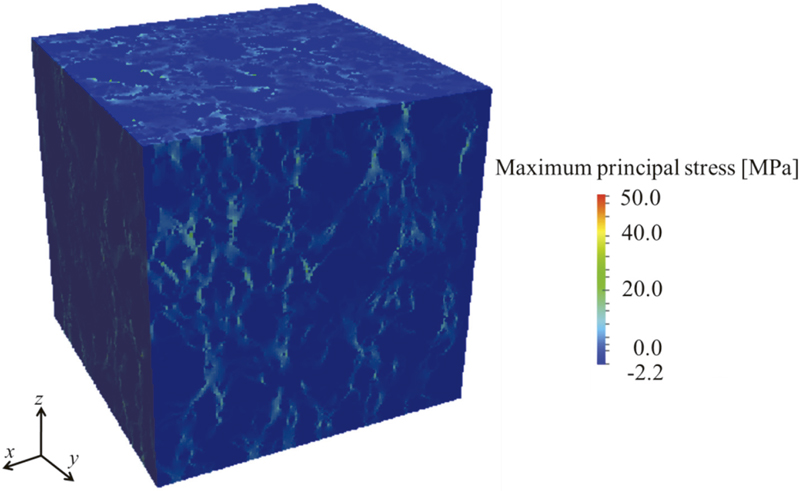
This study investigates the dominant factors affecting the strength of ferro-coke, which is produced by blending iron oxide with coal particles, with the addition of hyper-coal (HPC), to produce a high reactivity and strong coke. A diametral compression test for ferro-coke with and without HPC addition is performed. A three-dimensional ferro-coke model is then developed using micro X-ray computed tomography, and the relative proportions of pore, pore wall, iron, and pore space surrounding the iron particles, termed here “defect”, are quantified using this model. Moreover, a stress analysis is performed for the ferro-coke model. The diametral compression tests indicate that the strength of ferro-coke increases with the increasing blending ratio of HPC. The image-based modeling indicates that the wall thickness increases and stress concentration is relaxed with increasing addition of HPC due to enhancement of the adhesiveness of coal particles. On the other hand, the relative proportion of the “defect” is independent of HPC addition. Therefore, ferro-coke strength is found to be determined not by the “defect” around iron oxide but by the wall thickness.
View full abstractDownload PDF (3386K) Full view HTML
-
Takaaki Tanaka, Yuki Toji, Pawel Kozikowski, Masato Ohnuma, Miho Nagan ...2019 Volume 105 Issue 10 Pages 965-974
Published: 2019
Released on J-STAGE: September 30, 2019
JOURNAL OPEN ACCESS FULL-TEXT HTMLTransmission electron microscopy (TEM) is a powerful method for analyzing fine precipitates because it can measure the size of precipitates directly. In contrast, small angle X-ray scattering (SAXS) covers much larger observation volumes and has an advantage in the quantitativity of statistical representative values. However the consistency between results obtained by SAXS and TEM has been less discussed quantitatively, especially in the case of precipitates having anisotropic shapes. In this study, the quantitativity of SAXS was investigated by comparing SAXS and TEM analysis of TiC in high strength steels. Samples with various size distribution of TiC were prepared. The average size, number density and volume fraction of TiC were obtained by SAXS analysis performed on these samples using both sphere and disk form factor. Regardress of the form factor, the average size and volume fraction were almost the same, whereas the number density differed by one order. The average size of TiC measured by SAXS analysis was consistent with that obtained by TEM. Since it is considered that the difference in the number density depending on the form factors is attributed to an error due to the overestimation of size distribution width, the average number density was defined to correct this overestimation. The average number density calculated from the results using both form factors well agreed, which were a reasonable value. It was found that using sphere form factor with good convergence is effective to discuss the average information of the precipitates.
View full abstractDownload PDF (4046K) Full view HTML -
Kouichi Tsuji, Ryohei Hosomi2019 Volume 105 Issue 10 Pages 975-980
Published: 2019
Released on J-STAGE: September 30, 2019
JOURNAL OPEN ACCESS FULL-TEXT HTMLDetails of corrosion process of the steel sheet under stress load in the solutions have not been understood well. In this case, it is important to observe the corrosion process in liquid solutions by using nondestructive analytical method. Therefore, we applied a confocal micro-XRF analytical method for this purpose. This method enables a nondestructive elemental imaging near the surface of the materials in the solution. We prepared a sample cell where a Zn plating steel sheet was placed under stress load in NaCl solution. Zn and Fe XRF images were successfully observed in situ for 5 days in two analytical modes: cross sectional XRF imaging and depth-selective XRF imaging.
View full abstractDownload PDF (12030K) Full view HTML -
Ryohei Tanaka, Keita Yamasaki, Hiroko Seki, Yuuki Matsumoto, Jun Kawai2019 Volume 105 Issue 10 Pages 981-987
Published: 2019
Released on J-STAGE: September 30, 2019
Advance online publication: August 09, 2019 JOURNAL OPEN ACCESS FULL-TEXT HTML
Energy dispersive X-ray fluorescence (ED-XRF) spectrometer was built in the laboratory with low wattage X-ray tube and silicon drift detector using a 3D printer. SUS 304 and 316L stainless steels were measured by the ED-XRF spectrometer and a sequential type inductively-coupled plasma atomic emission spectrometer (ICP-AES). The results of quantitative analysis obtained by the fundamental parameter (FP) program developed by the authors were compared with the ICP-AES results, and concluded the following three points.
(1) The FP method is a first principles method to theoretically calculate the concentration of elements using XRF. The accuracy and precision are satisfactory but inferior to the calibration curve method.
(2) The representative accuracy and precision in SUS 304 quantification are expressed as 18.3±0.08% for Cr and 18.1±0.01% for Ni. These values are comparable to the accuracy and precision of ED-XRF. Therefore the FP method is suitable for the ED-XRF analysis; the calibration curve method (dj method) is highly precise and accurate, and thus suitable for wavelength dispersive (WD) XRF method.
(3) Though it is said that the FP databases should be improved in order to increase the accuracy, the FP database improvements have not been effective.
View full abstractDownload PDF (1030K) Full view HTML
-
Keisuke Fukuda, Yuki Kashiwa, Satoshi Oue, Tomio Takasu, Hiroaki Nakan ...2019 Volume 105 Issue 10 Pages 988-997
Published: 2019
Released on J-STAGE: September 30, 2019
 JOURNAL OPEN ACCESS FULL-TEXT HTML
The electrodeposition of invar Fe-Ni alloy with low thermal expansion was performed at 100-5000 A·m–2 and 105 C·m–2 in agitated Watt’s solution containing NiSO4, NiCl2, FeSO4, C3H4O4, C7H4NNaO3S and H3BO3 at 50ºC. With increasing the concentration of malonic acid, the Ni content in deposits decreased at higher current density region than 2000 A·m–2, while it increased at lower current density region than 1000 A·m–2. The current efficiency for alloy deposition decreased with increasing the concentration of malonic acid. The deposits were composed of granular crystals whose size decreased with increasing the concentration of malonic acid. With an addition of saccharin, the Ni content in deposits significantly decreased, and the current efficiency for alloy deposition increased. With an addition of boric acid, the Ni content in deposits somewhat decreased, and the current efficiency for alloy deposition increased. The surface morphology of deposits changed with the current density and an addition of saccharin, and rarely changed with an addition of boric acid. It was found that the morphology depended on the Ni content in deposits. The deposits with Ni content of 29-38 mass% were composed of granular crystals approximately 300 nm in size, while the deposits with Ni content of 41-52 mass% showed the smooth surface consisted of fine crystals. The effects of additives on the Ni content in deposits and current efficiency can be explained by the change of partial polarization curve for Fe and Ni deposition and hydrogen evolution in Fe-Ni alloy deposition.
View full abstractDownload PDF (2264K) Full view HTML
-
Kenta Hanawa, Yusuke Onuki, Yuta Uemura, Akinori Hoshikawa, Shigeru Su ...2019 Volume 105 Issue 10 Pages 998-1007
Published: 2019
Released on J-STAGE: September 30, 2019
 JOURNAL OPEN ACCESS FULL-TEXT HTML
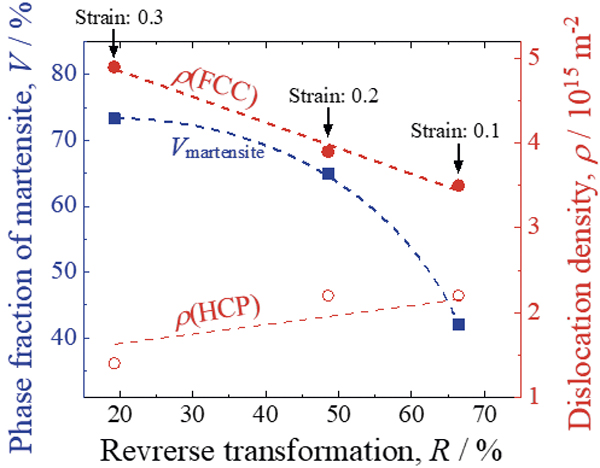
Relationship between phase transformation and dislocation evolution of Fe-Mn-Si-Cr shape memory alloy upon tensile deformation and subsequent annealing treatment was investigated. Neutron diffraction and electron backscatter diffraction (EBSD) measurements were carried out to evaluate dislocation density and phase transformation. Reasonable phase fraction of martensite was evaluated by Rietveld-texture analysis via neutron diffraction. It was confirmed that EBSD tends to underestimate the phase fraction of martensite. Kernel average misorientation (KAM) analysis was carried out by the EBSD to analyze geometrically necessary (GN) dislocation density. The KAM values of austenitic and martensitic phases increased linearly with nominal strain and did not vary despite the annealing treatment for reverse transformation. On the other hand, dislocation density of austenitic phase, which was estimated by neutron diffraction line-profile analysis, decreased with the annealing treatment. The dislocation density evaluated by neutron diffraction was one digit higher than GN dislocation density estimated by KAM values. This is because neutron diffraction evaluates total dislocation density of not only GN type but also statistically stored (SS) type. Thus, it was indicated that SS dislocations annihilated by recovery whereas GN dislocation remained during the annealing treatment. Interestingly, the total dislocation density of martensitic phase was almost constant irrespective of nominal strains and increased with the annealing treatment. These dislocation evolution behaviors and the effects of dislocations on the reverse transformation were discussed.
View full abstractDownload PDF (3190K) Full view HTML -
Takako Yamashita, Masato Enomoto, Yuji Tanaka, Hiroshi Matsuda, Kaneha ...2019 Volume 105 Issue 10 Pages 1008-1016
Published: 2019
Released on J-STAGE: September 30, 2019
Advance online publication: June 06, 2019JOURNAL OPEN ACCESS FULL-TEXT HTMLControlling carbon concentration and its distribution among constituent phases is one of the most important issues to achieve high strength and ductility in the design of steel. The carbon distribution near the α/γ interface at the early stage of isothermal holding at 750ºC was measured and visualized in Fe-C-Mn-Si alloys, containing 2 mass%Si and 1.5 or 2 mass%Mn, using recently developed high precision FE-EPMA, and results were compared with the theory of ferrite growth in multi-component low alloy steel. The carbon concentrations at α/γ interfaces in austenite were generally between the NPLE/PLE and paraequilbrium γ/(γ+α) boundary concentrations. In alloys of carbon content smaller than the NPLE/PLE boundary, it seems that α/γ interfaces migrated under the condition close to paraequilibrium or with partially developed spikes of alloy elements at early stages. On the other hand, in alloys of bulk composition on the boundary and its higher carbon concentration side, Mn enrichment was observed at the interfaces, and the carbon concentration tended to be higher than those in alloys of lesser carbon content, albeit there were variations at individual interfaces.
View full abstractDownload PDF (9159K) Full view HTML -
Ryusuke Nakamura, Yuki Hanya, Manabu Ishimaru, Takeshi Wada2019 Volume 105 Issue 10 Pages 1017-1021
Published: 2019
Released on J-STAGE: September 30, 2019
JOURNAL OPEN ACCESS FULL-TEXT HTMLAmorphous Fe-B thin films of the concentration range between 12 and 25 at.% B were prepared by radio frequency sputtering techniques, and their local structures were examined by transmission electron microscopy. Pair-distribution-function analyses of Fe-12, -18 and -25 at.%B for a region of 300 nm in diameter revealed a systematic trend according to the concentration; with the increase in B concentration, the intensity of the weak shoulder peak at 0.205 nm for the Fe-B pair increases whereas those of main peaks for Fe-Fe pair decrease. In electron diffraction patterns of the samples taken by a probe size of 2 nm, the specific spots of iron-borides, such as Fe3B and Fe23B6, were detected, suggesting the atomic arrangement of the compounds in the amorphous matrices.
View full abstractDownload PDF (1057K) Full view HTML
-
Teruki Sadasue, Tsunehisa Handa, Tetsuya Tagawa2019 Volume 105 Issue 10 Pages 1022-1031
Published: 2019
Released on J-STAGE: September 30, 2019
 JOURNAL OPEN ACCESS FULL-TEXT HTML
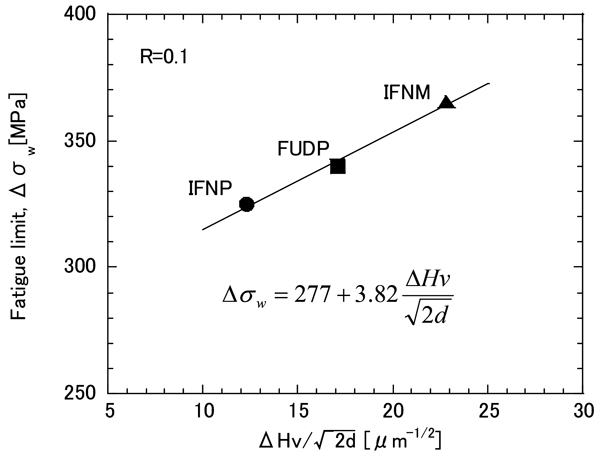
Fatigue strength in 3types of steel plates, IFNP (Isolated Ferrite covered with Network Pearlite), IFNM (Isolated Ferrite covered with Network Martensite) and FUDP (Ferrite with Uniformly Dispersed Pearlite) with almost the same tensile strength were investigated. Fatigue limits of IFNP and FUDP, consist of ferritic/pearlitic microstructure, were dominated by only cyclic yield strength regardless of ferrite grain size or volume fraction of pearlite phase. However, a fatigue limit exceeded the cyclic yield strength at IFNM.
Propagation of a small fatigue crack within a ferrite grain toward grain boundary adjacent to hard phase was simulated by a micro-mechanics model at IFNP and IFNM. It was considered that the fatigue crack growth driving force of the small fatigue crack was reduced near grain boundary, because the spread of slip band of the fatigue crack tip was restricted by hard phase. It was also considered that the reduction of the fatigue crack driving force promoted by increase of hardness of hard phase. There was a reasonable correlation between calculated range of crack tip opening displacement and threshold of stress intensity factor range at IFNM and IFNP.
Fatigue limits could be evaluated by a Petch type equation as a function of ferrite grain size and the difference in hardness between ferrite phase and hard phase. According to the equations proposed in this study, it can be expected that refinement of ferrite grains and increase of difference in hardness between ferrite phase and hard phase are effective to enhance fatigue limit of the steels.
View full abstractDownload PDF (7166K) Full view HTML
- |<
- <
- 1
- >
- >|