
- |<
- <
- 1
- >
- >|
-
Kenta Fukumoto, Satoshi Oue, Yoshiharu Kikuchi, Shinya Akamatsu, Tomio ...Article type: Regular Article
2019 Volume 83 Issue 11 Pages 399-406
Published: November 01, 2019
Released on J-STAGE: October 25, 2019
Advance online publication: August 30, 2019 JOURNAL FREE ACCESS FULL-TEXT HTML
Electrodeposition of Zn was performed on a Fe electrode at a current density of 20-5000 A·m−2 and a charge of 4 × 10⁴ C·m−2 in an unagitated zincate solution containing 0.62 mol·dm−3 of ZnO, 4.0 mol·dm−3 of NaOH and organic additives at 313 K. The effects of organic additives on the deposition behavior of Zn and the microstructure of the deposits were investigated. The films deposited at current densities higher than 1000 A・m−2 from the solution containing additives of a straight-chain polymer composed of quaternary ammonium cation (PQ) and a quaternary ammonium salt with benzene ring (QA) exhibited the gloss. The polarization curve was separated into a partial polarization curve of Zn deposition and that of hydrogen evolution by using the galvanostatic data of Zn deposition. The overpotentials of charge transfer of Zn deposition and that of ZnO22− ions diffusion increased with additions of PQ and QA. The increase in overpotential was remarkable at potential less noble than −1.5 V. Zn deposition reached the diffusion limit of ZnO22− ions at potential less noble than −1.5 V, indicating that the diffusion of ZnO22− ions was greatly suppressed by PQ and QA. With additions of PQ and QA, the C, N and H were co-deposited with Zn, showing that the additives of PQ and QA were incorporated in deposited films. The size of the Zn crystallite decreased with increasing current density. At a high current density of 5000 A・m−2, the crystallite size decreased furthermore with additions of PQ and QA and the film showed the smooth surface. The orientation index of the {1010} plane of Zn deposited from the solution containing PQ and QA increased with current density. The change of the crystallite size and crystal orientation of deposited Zn were explained related to the deposition overpotential.
Partial polarization curves for Zn deposition from the solutions with and without additives and SEM images of deposited Zn.[ ● Additive-free, △ With QA, □ With PQ, ◆ With PQ and QA] Fullsize ImageView full abstractDownload PDF (7322K) Full view HTML -
Kosuke Hayashi, Yasuyoshi Hidaka, Hideo Cho, Kaita HyodoArticle type: Regular Article
2019 Volume 83 Issue 11 Pages 407-415
Published: November 01, 2019
Released on J-STAGE: October 25, 2019
Advance online publication: October 04, 2019 JOURNAL FREE ACCESS FULL-TEXT HTML
The fracture behavior of oxide scales formed on carbon steel with various structures was evaluated using indentation test and acoustic emission method. FeO scale on steel, which had relatively fragile and poor adhesion, became hard to crack with precipitation of fine Fe3O4 grain. However, FeO eutectoid transformation made surface of oxide scale fragile during the indentation test. This is because the volume expansion during the transformation applied tensile stress to surface Fe3O4, which became likely to crack from the surface.
Fig. 24 Schematic illustration of phase transformation and fracture behavior of oxide scales. Fullsize ImageView full abstractDownload PDF (3655K) Full view HTML -
Yoshinobu Yasuda, Hiroyuki Abe, Ryozo Matsubayashi, Toru Maruyama, Tak ...Article type: Regular Article
2019 Volume 83 Issue 11 Pages 416-423
Published: November 01, 2019
Released on J-STAGE: October 25, 2019
 JOURNAL FREE ACCESS FULL-TEXT HTML
This study aimed to clarify the influence of crystallized particles in Pb-free Cu alloys (JIS CAC411 and CAC901) on the corrosion in a chloride aqueous solution. CAC411, CAC901, CAC403, and CAC406 were used as Cu alloy specimens. Cu2S, Bi, and Pb were used as simulated crystallized substances of CAC411, CAC901 and CAC406, respectively, and Cu was used as the simulated matrix. All the corrosion tests described below were conducted in a 3.0 mass%NaCl solution at 30℃. The corrosion rates of CAC411 and CAC901 specimens were almost the same as that of CAC403, but lower than that of CAC406 specimen in the early stages of the immersion-corrosion test. For galvanic corrosion tests, the galvanic current density flowing between the simulated crystallized substance specimens (Cu2S or Bi) and the simulated matrix specimen was much lower than the reduction current density of dissolved oxygen. In the case of Pb, the galvanic current flowed from the simulated matrix specimen to the Pb specimen, and the current density on the Pb specimen was significantly larger than the reduction current density of dissolved oxygen. It was concluded that susceptibility to galvanic corrosion between matrix and Cu2S or Bi were much smaller than that of Pb, and those crystallized substances did not significantly affect the corrosion behavior of CAC411 and CAC901.
Fig. 11 Schematic diagram of the corrosion behavior of CAC411, CAC901, and CAC406 in the 3.0 mass%NaCl aqueous solution. Fullsize ImageView full abstractDownload PDF (2104K) Full view HTML -
Chikako Takushima, Jun-ichi HamadaArticle type: Regular Article
2019 Volume 83 Issue 11 Pages 424-433
Published: November 01, 2019
Released on J-STAGE: October 25, 2019
Advance online publication: September 30, 2019 JOURNAL FREE ACCESS FULL-TEXT HTML
In this study, thermal fatigue tests in the temperature ranges 473-873 K, 473-973 K, and 473-1073 K, with a restriction ratio of 100%, were conducted using 13%Cr-Nb-Si added steel, which is a representative heat-resistant ferritic stainless steel for automotive exhaust systems. The effects on the thermal fatigue, i.e., the thermal fatigue life and response of stress and strain, and changes in the microstructure were investigated. Comparison of the thermal fatigue life in the different temperature ranges revealed that the fatigue life improved with a decrease in the maximum temperature. The relationship of the inelastic, elastic, and total strain with the thermal fatigue life was estimated using the Coffin-Manson and Basquin laws. Using these, the curves for predicting the life on the maximum temperature could be obtained. In addition, a detailed observation of the interrupted specimens at the maximum temperatures of 973 K and 1073 K using electron back scatter diffraction confirmed the occurrence of dynamic recovery and recrystallization, along with uniaxial and fine grain formation. However, there was no dynamic recrystallization at the maximum temperature of 873 K. Changes in the microstructure during thermal fatigue were quantified by the frequency of the low-angle boundary, and the expression for dynamic recovery and recrystallization was formulated using the Zener-Hollomon parameter and cumulative inelastic strain range. Furthermore, together with 18%Cr-Nb-Mo added steel, from the consideration of the stress relaxation behavior during holding at the maximum temperature in the thermal fatigue and the prediction curves of fatigue life, it was shown that the thermal fatigue strength was improved by approximately 100 K in terms of temperature by the addition of 2% Mo.
Fig. 10 Distribution of the high-angle boundary (≧15°) and low-angle boundary (<15°) for Steel A interrupted at (a) 300 cycles, (b) 500 cycles, (c) 700 cycles, and (d) 1001 cycles with a maximum temperature of 973 K and a restriction ratio of 100%. The black and red lines represent the high-angle boundary and low-angle boundary, respectively. Fullsize ImageView full abstractDownload PDF (5568K) Full view HTML -
Kazuyuki Shimizu, Hirotoshi Hayashida, Hiroyuki Toda, Tetsuya Kai, Yos ...Article type: Regular Article
2019 Volume 83 Issue 11 Pages 434-440
Published: November 01, 2019
Released on J-STAGE: October 25, 2019
Advance online publication: October 04, 2019 JOURNAL FREE ACCESS FULL-TEXT HTML
The visualization of hydrogen distribution in materials is important to understand hydrogen embrittlement behavior. Neutron imaging experiment was carried out in order to visualize the distribution of solute hydrogen in an Al-10.1%Zn-1.2%Mg alloy and a pure palladium after hydrogen charging. Changes in the contrast of neutron transmission images caused by hydrogen were clearly observed in a palladium. In the wavelength range of 2-3 Å and 5-13.5 Å, the mean neutron transmission around the center of a hydrogen-charged palladium were 0.692 and 0.511, respectively. The hydrogen content in a palladium was estimated to be 10.8 mol% from the measured neutron transmission. In this study, it has been demonstrated that hydrogen content can be analyzed even in non-monochromatic neutron imaging by considering the wavelength dependence of neutron intensity, and the effects of incoherent scattering and of Bragg-edge on transmission. On the other hand, hydrogen could not be observed from the neutron transmission image in Al-Zn-Mg alloys. This was due to the low hydrogen content, which was mass ppm level even after hydrogen charging, and statistical precision was not sufficient to discuss the amount of hydrogen of the mass ppm order.
Fig. 2 Neutron transmission images captured at the wavelength range of (a) 2-3 Å and (b) 5-13.5 Å. Fullsize ImageView full abstractDownload PDF (1149K) Full view HTML -
Yasushi Haraguchi, Ryota Shibuya, Shungo Natsui, Tatsuya Kikuchi, Ryos ...Article type: Regular Article
2019 Volume 83 Issue 11 Pages 441-448
Published: November 01, 2019
Released on J-STAGE: October 25, 2019
Advance online publication: October 21, 2019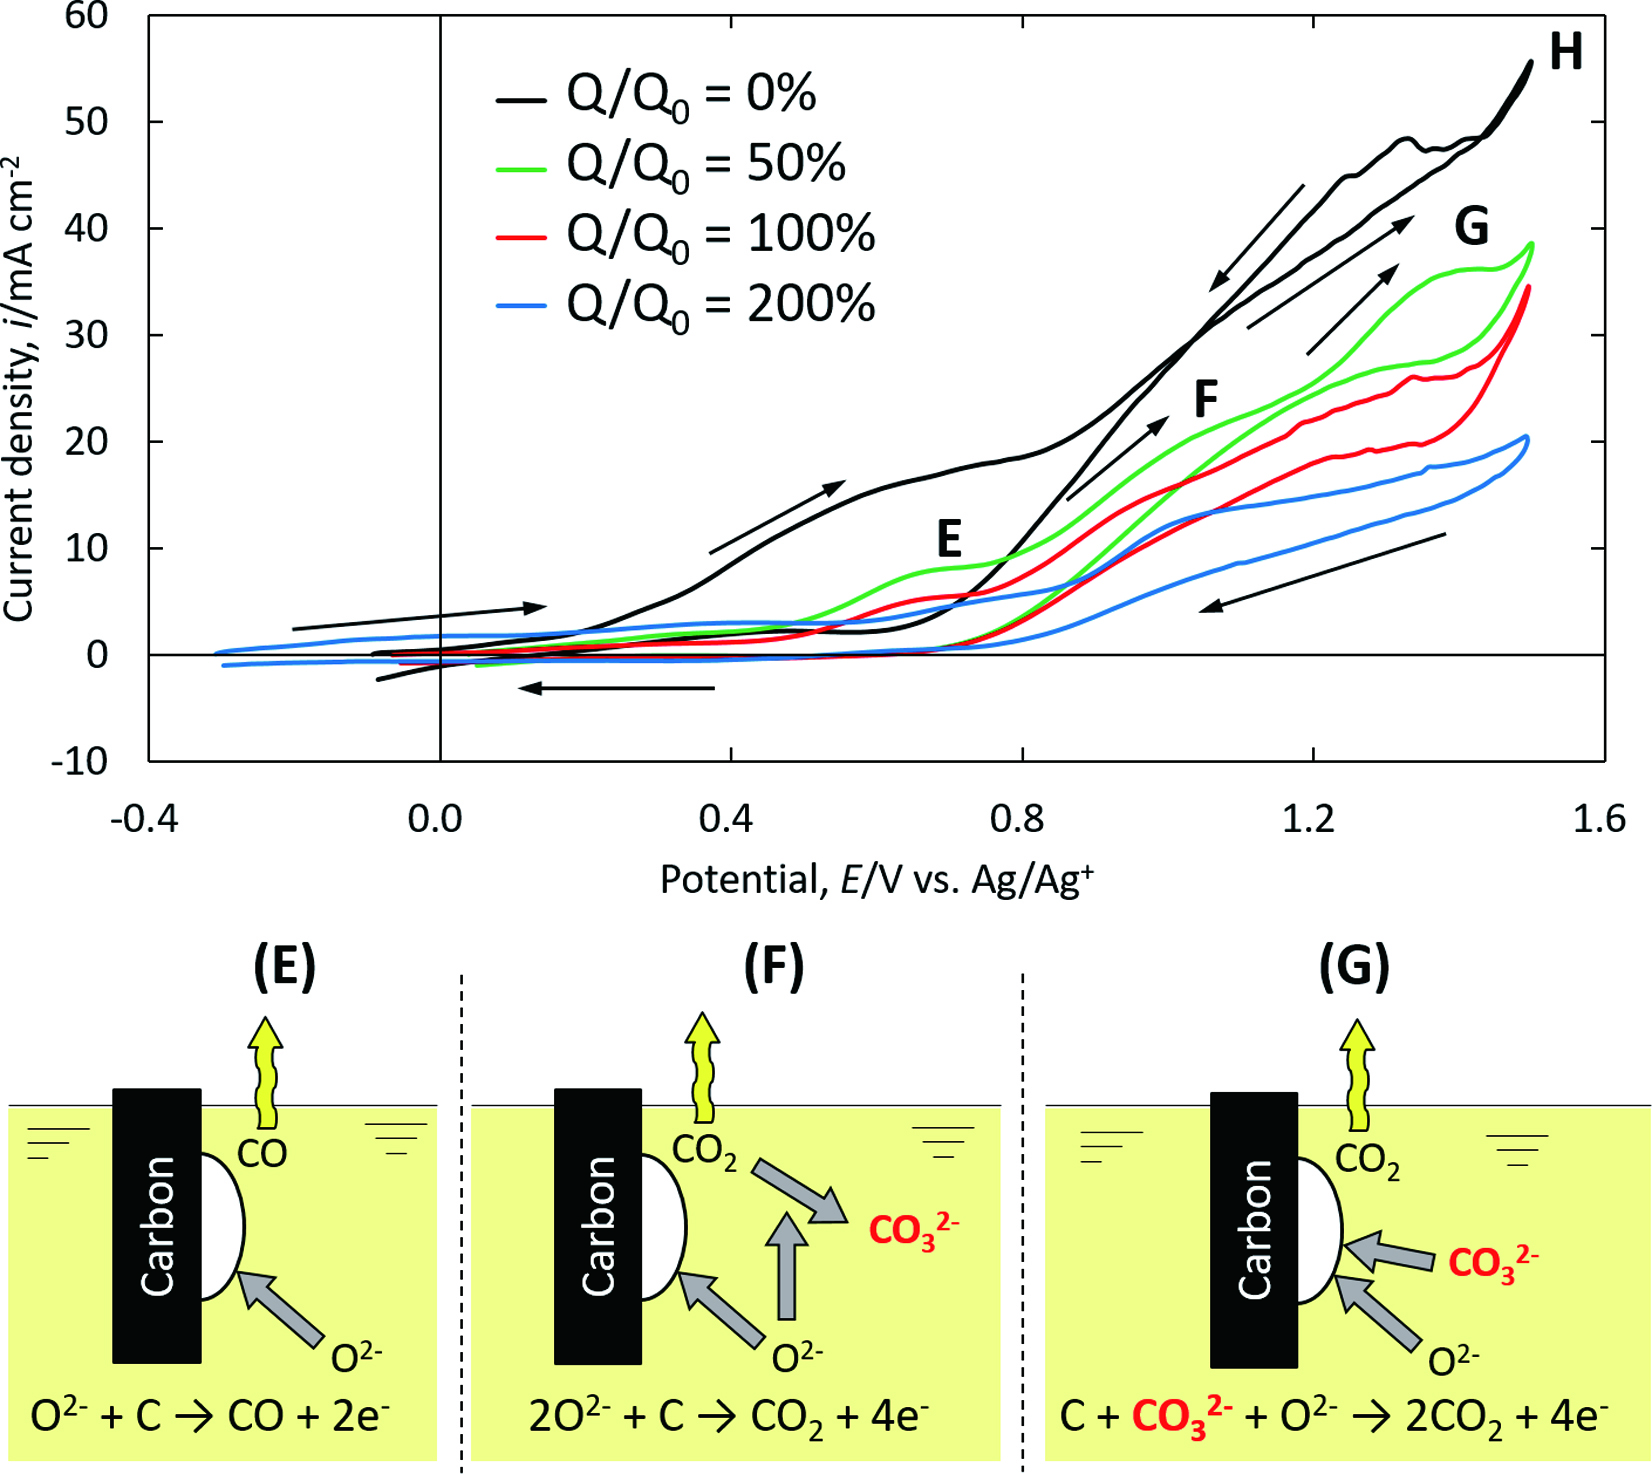 JOURNAL FREE ACCESS FULL-TEXT HTML
Titanium dioxides were reduced to metallic titanium via molten salt electrolysis using CaCl2. It was reported that the efficiency was low because some side reactions produced carbon precipitates. To produce titanium more efficiently, these electrochemical side reactions were examined by cyclic voltammetry (CV). O2- reacted with the carbon anode to form CO and CO2 gas bubbles, which easily dissolved into the molten salt and formed CO32-, subsequently generating carbon powder. CV was performed after interrupting electrolysis temporarily. The electrochemical reduction of CO32- in the cathodic scan was not observed, suggesting that CO32- was spontaneously reduced by Ca during electrolysis. Anodic reactions preceding Cl2 gas generation occurred in three steps: CO and CO2 gas generation related to O2-, and successive CO2 generation related to CO32-.
Cyclic voltammogram and schematic image of various steps of anodic reaction. Fullsize ImageView full abstractDownload PDF (2764K) Full view HTML
- |<
- <
- 1
- >
- >|